Paytm (One97)
DCF Model Snapshot
Part 1: Understanding the Business — What Does Paytm Actually Do?
Before we value any company, we need to understand where its money comes from and what structural advantages — if any — allow it to sustain and grow those cash flows. Paytm operates across three distinct business segments, each with a different revenue profile, margin structure, and growth trajectory. Getting this right is the foundation of the entire model.
Segment 1: Payment Services
Payment services is Paytm's oldest and most recognizable business. The company facilitates both person-to-person (P2P) and person-to-merchant (P2M) transactions through its app and merchant network.
The revenue nuance most people miss: Paytm earns zero revenue on P2P transactions — these are essentially a user acquisition and retention tool. Revenue only kicks in when Paytm acts as a financial intermediary in P2M transactions, earning what is called Merchant Discount Rate (MDR). However, a critical structural headwind exists: MDR has been waived by the government on UPI transactions, which are now the dominant mode of digital payments in India. This means that for the largest and fastest-growing chunk of digital payment volume, Paytm currently earns nothing in the traditional sense. The business therefore splits into three meaningful sub-lines:
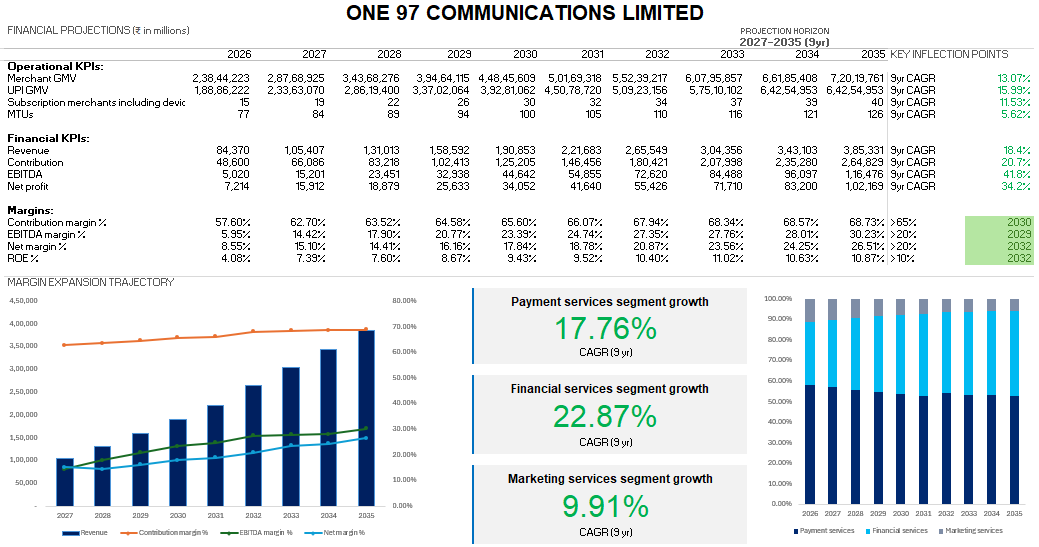
- Payment Processing Revenue (non-UPI MDR): When merchants accept payments via credit cards, debit cards, wallets, or EMI instruments, Paytm earns MDR on those transactions. The current blended take-away rate in the model is approximately 0.148% (derived from FY26 quarterly data), and this is expected to inch up marginally to 0.15% as the revenue mix shifts slightly toward higher-MDR instruments. This is a deliberate conservative call — no significant repricing has been assumed because UPI's dominance suppresses aggregate blended rates.
- Device Subscription Revenue (the recurring annuity): Despite having lower market share than PhonePe or Google Pay in P2P volumes, Paytm's real competitive moat sits in its merchant base of approximately 87 million as of FY26, with around 15.1 million merchants carrying subscription devices — soundboxes (smart audio payment confirmation devices) and POS terminals. These merchants pay a recurring monthly fee per device. As of FY26, this subscription revenue per device per month stands at approximately ₹67. This is structurally sticky: once a merchant installs a soundbox, the switching cost is real. This line contributes approximately 24.3% of total payment services revenue in FY26 and is arguably the highest-quality revenue stream in the entire business.
- UPI Incentive / Future MDR Revenue: Currently, Paytm earns no MDR on UPI P2M transactions. Instead, the government provides an incentive scheme to UPI ecosystem participants; Paytm received approximately ₹700 million in incentives in FY25. The model holds this flat through FY31 under base case assumptions. However, the long-run sustainability of UPI as a zero-MDR infrastructure is widely debated. The RBI and ecosystem participants have signaled that some form of MDR on UPI — likely in the range of 0.2–0.3% — may eventually be introduced to ensure infrastructure viability. In the model, UPI MDR introduction has been penciled in at FY2032 under the base case, with a Paytm-specific blended take-away rate of 0.05% (reflecting only Paytm's share of the MDR pool, not the full MDR charged to merchants). This is a significant inflection point in the revenue build — when it triggers, it creates a step-change in payment services revenue.
Segment 2: Distribution of Financial Services
This is where Paytm's structural positioning as a distribution platform — rather than a lender — becomes most valuable. Paytm does not take credit risk on its books. Instead, it connects its 87 million merchant base and 77 million Monthly Transacting Users (MTUs) with lending and financial services partners, earning a fee or commission for distribution. This makes the economics fundamentally different from an NBFC: the revenue is high-margin, capital-light, and doesn't blow up when credit cycles turn. The segment in FY26 breaks into three sub-streams, based on Q3 FY26 mix:
- Merchant-Led Credit (~51% of segment revenue): Paytm provides working capital loans to its merchant base through partner lenders. As of FY26, approximately 7% of its 15.1 million subscription device merchants carry an outstanding loan, with a ticket size of approximately ₹2.41 lakhs. The blended rate earned by Paytm on loan disbursals is 5.75% of the outstanding loan book (this is Paytm's take-rate on the distributed loan, not the all-in interest rate to the borrower). The penetration of loans-to-merchants (currently 7%) is expected to gradually scale to 10% by FY35 as the merchant base grows, trust deepens, and repeat lending increases.
- Consumer-Led Credit (~35.6% of segment revenue): Paytm distributes consumer credit products including its Postpaid (buy now, pay later) service and credit cards to its MTU base. This line is modeled at a 14% CAGR through the forecast period, with early years growing slightly faster as the distribution engine matures and regulatory conditions normalize post the NPCI/RBI episodes of FY24.
- Paytm Money (~13.1% of segment revenue): Paytm Money is the wealth management arm, offering mutual fund investments, stockbroking, and more recently a Margin Trading Facility (MTF). This is a high-optionality bet — if India's financialization of savings continues (which historical trends strongly suggest), Paytm Money sits on an enormous addressable base. This sub-segment has been modeled at a 15% CAGR, slightly higher than consumer credit, reflecting the earlier stage of the product cycle and higher growth potential from MTF and SIP penetration.
The financial services segment as a whole is the highest-margin business in Paytm's portfolio. Unlike payment processing where Paytm competes with network costs and payment gateway fees, here the contribution to the bottom line is structurally superior — the cost of acquiring these customers is largely already sunk through the payments platform.
Segment 3: Marketing Services
This is a relatively straightforward and explicitly non-core segment, as management has communicated in recent concalls. Following the sale of Paytm's ticketing services business to Eternal (formerly Zomato), the high-growth engine that was once in this segment no longer exists under Paytm's roof. What remains is essentially an advertising and cross-sell monetization business — Paytm earns revenue by monetizing its user base through ads, promotional tie-ups, and branded campaigns shown to MTUs on its platform.
The mechanics are simple: Revenue = MTUs × Revenue per MTU. MTUs stood at 77 million in FY26, and revenue per MTU was approximately ₹31 per quarter. Management has guided for revenue per MTU to stabilize and grow modestly from here. The model assumes 4% annual growth in revenue per MTU, with MTUs themselves growing to approximately 126 million by FY35 as internet and fintech penetration deepens.
This segment's 9-year CAGR works out to approximately 9.9% — respectable but clearly not the business Paytm is betting its future on. The model treats this as a steady cash contributor rather than a growth driver.
Part 2: The Valuation Story — How the Model is Built
With the business understood, the next step is translating that understanding into a rigorous, defensible forecast. A 9-year explicit forecast period (FY2027–FY2035) has been used, appropriate for a high-growth, platform-type business where the terminal year needs to reflect a normalized steady state that is materially different from today.
The model is structured as a 3-Statement + DCF + Comparable Company Analysis (Comps), with three scenarios — bear, base, and bull — driven off a unified assumption sheet.
Payment Services TAM Build — Top-Down to Bottom-Up
Rather than simply applying a growth rate to revenue, the model builds up from India's macro consumption trajectory and digital penetration trends.
Merchant Payment Processing TAM:
The starting anchor is India's total final consumption expenditure, which stood at approximately ₹220 trillion in FY26. Of this, digital payment-led consumption currently accounts for approximately 53.2% (or ~₹117.2 trillion), derived from the government's own P2M digital payments market data. By FY35, with India's digital payments infrastructure maturing, the digital consumption share is expected to reach 85% — implying a total P2M digital payments market of approximately ₹423.6 trillion. The consumption base itself grows at a nominal rate of 9.5% per annum through FY35, consistent with India's historical GDP growth plus inflation trajectory.
Paytm's market share in this P2M GMV is assumed to decline modestly from 20.3% in FY26 to 17.0% in FY35 — a deliberate conservative call acknowledging the dominance of PhonePe and Google Pay in the P2P-to-P2M funnel. The blended take-away rate rises marginally from 0.148% to 0.150% as the mix tilts toward higher-MDR instruments over time.
Subscription Device TAM:
India currently has approximately 87 million merchants, of which approximately 66% accept digital payments (roughly 57 million). Of these, Paytm has penetrated approximately 15.1 million with subscription devices — a penetration rate of about 26.1% on its total registered merchant base.
The TAM builds forward using two drivers: merchant count growth (assumed at 3.5% per annum — essentially driven by the formalization of India's retail sector and white-collar workforce expansion) and digital payment acceptance among merchants (expected to rise from 66% to 85% by FY35). By FY35, this implies a total merchant base of approximately 118.6 million, with 85% or roughly 100.8 million accepting digital payments.
Within this, the assumed number of subscription devices as a percentage of total Paytm merchants rises from 26.1% in FY26 to 40.0% in FY35, implying approximately 40.3 million devices by the end of the forecast period. Combined with subscription revenue per device per month growing at 10% per annum (from ₹67 in FY26 to ₹158 by FY35), device subscription revenue scales from approximately ₹10,720 million in FY26 to ₹76,470 million by FY35 — a segment CAGR of roughly 24%.
UPI MDR TAM:
The UPI GMV TAM is built similarly to the merchant payment services TAM, but calibrated to UPI-specific transaction data. Industry P2M UPI GMV was approximately ₹90.9 trillion in FY26. With UPI consumption share rising from 41.3% to 80% by FY35 and total nominal consumption growing at 9.5%, the industry UPI P2M GMV reaches approximately ₹398.7 trillion by FY35.
Paytm's UPI P2M market share is assumed to drift from 20.8% in FY26 to 18.0% in FY35 — again a conservative assumption given the structural loss of UPI market share post the NPCI FME cap and RBI-related disruptions in FY24. A key structural assumption: approximately 66.5% of UPI value is in transactions above ₹2,000, which is the likely threshold above which any future MDR regime would apply. The model applies a Paytm-specific take-away rate of 0.05% on this eligible GMV, starting FY2032.
Until FY2031, the UPI incentive remains at ₹700 million per year (flat, conservative). From FY2032, revenue jumps to approximately ₹12,003 million — representing the single biggest year-on-year step-change in the entire model and the biggest bull-case catalyst if MDR arrives earlier than FY2032.
Financial Services TAM Build
Merchant Credit TAM:
Starting from the FY26 base of approximately 1.057 million loans outstanding (7% of 15.1 million subscription device merchants), the model grows merchant count in line with the subscription device build, and gradually increases loan-to-merchant penetration to 10% by FY35. Ticket sizes start at ₹2.415 lakhs and grow at 14% in FY27–28, stepping down gradually to 6.5% by FY33–35 as the base matures. The blended rate earned by Paytm is held constant at 5.75% throughout the forecast — a conservative assumption that does not assume fee inflation, reflecting a competitive lending marketplace.
By FY35, this sub-segment generates approximately ₹1,25,780 million in revenue, up from approximately ₹14,678 million in FY26 — implying it becomes the single largest revenue line in the financial services segment and a key driver of overall company profitability.
Consumer Credit and Paytm Money:
Consumer credit is assumed to grow at 14% CAGR and Paytm Money at 15% CAGR, with slight adjustments in multipliers each year to smooth the trajectory. These are not top-down TAM-constrained assumptions, but rather driven by company-specific guidance and the broader financialization thesis.
Marketing Services TAM Build
The marketing services TAM is anchored to India's fintech user base trajectory. As of FY26, India has approximately 515 million fintech app users, representing about 54.6% of India's internet population (at 64% internet penetration). By FY35, with internet penetration rising to 80% and the fintech-to-internet user ratio improving to 75%, the implied total fintech user base reaches approximately 900 million.
Paytm's share of this fintech user base is assumed to decline marginally from 14.95% in FY26 to 14.0% in FY35, translating to MTU growth from 77 million to approximately 126 million over the forecast period. Revenue per MTU grows at 4% annually, reaching ₹44.2 by FY35.
WACC and Discount Rate Construction
Paytm carries no debt, so the WACC equals the cost of equity — a significant simplification that also reflects the company's current capital structure reality.
The cost of equity is derived using the Damodaran framework for emerging market companies:
- India 10-year G-Sec yield: 7.075% (risk-free rate proxy before country risk adjustment)
- India default spread: 1.87%
- Adjusted risk-free rate: 5.205% (developed market equivalent)
- Developed market ERP: 4.46% (Damodaran's estimate)
- India's Country Risk Premium (CRP): 2.85%
- Adjusted beta: 1.116 in FY26, declining linearly to 1.0 by FY35 (as Paytm matures toward a steady-state business, its volatility and risk premium are expected to moderate)
This yields a starting cost of equity of approximately 13.03%, declining to 12.51% by FY35. The terminal WACC used is 10.37% — consistent with a normalized, mature-state Paytm operating with a beta of 1.0 with a D/E ratio of industry average.
Mid-year discounting has been applied to reflect that cash flows accrue throughout the year rather than purely at year-end — a more technically correct approach for operating businesses.
Eternal
DCF Model Snapshot
Eternal Limited — DCF Valuation: A Complete Walkthrough
Part 1: Understanding the Business
Eternal Limited (NSE: ETERNAL) is the parent company of what most people know as Zomato. The rebranding reflects a broader identity: this is no longer just a food delivery company. Eternal operates four distinct business segments, each with its own unit economics, growth trajectory, and market structure.
Food Delivery (Zomato)
This is the original and most mature segment. It operates as a marketplace — Eternal doesn't own kitchens or employ delivery partners full-time. It brings together restaurants (who pay commission), delivery partners (who earn per order), and customers (who pay platform and delivery fees, and optionally subscribe to Zomato Gold). Revenue is recognised as a "take rate" on Net Order Value (NOV) — the gross value of orders placed on the platform. In FY25, food delivery NOV stood at ₹32,862 Cr, and the take rate — adjusted revenue as a percentage of NOV — was approximately 28.7%. The four revenue streams are commission (~primary), advertising and promotions (restaurants paying for visibility), Zomato Gold subscriptions, and delivery fees.
Quick Commerce (Blinkit)
This is the high-growth segment and the most structurally complex one to model. Blinkit operates dark stores — small urban warehouses from which groceries and essentials are delivered in under 10 minutes. The single most important development in FY25-26 was Blinkit's shift from a marketplace model to an inventory-led model. Under the old model, Blinkit earned ~23% commission on NOV. Under the new model, Blinkit actually purchases and owns the inventory, so revenue now approximates full NOV (~93-95%). This inflated the revenue line dramatically — from ₹1,709 Cr in Q4 FY25 to ₹9,891 Cr in Q2 FY26 and ₹12,256 Cr in Q3 FY26 — while simultaneously introducing COGS on the books. The NOV for quick commerce in FY25 was ₹22,371 Cr, and Blinkit currently holds approximately 50% market share in Indian quick commerce, with stores at ~2,027 as of Q3 FY26.
Going Out (District)
This is the newest strategic pillar, launched in November 2024 after Eternal acquired Paytm's ticketing subsidiaries for ₹2,048 Cr. District covers four sub-segments: movie ticketing (competing directly with BookMyShow), live events (concerts, comedy, theatre — now India's second-largest events platform), sports ticketing (IPL, ISL, PKL), and dining out (restaurant discovery and table reservations). District's revenue model is a take rate on NOV — ticketing commission, convenience fees, advertising from venues, and dining reservation fees. FY25 NOV was ₹6,619 Cr, and management has guided for District to become a $3B NOV business with 5% Adjusted EBITDA margin by FY30.
B2B Supplies (Hyperpure)
This is Eternal's farm-to-fork supply chain arm, serving restaurants directly. Hyperpure sources vegetables, dairy, meat, and other perishables directly from farmers and delivers them to over 1 lakh partner restaurants across 130+ cities. Revenue is essentially 100% of NOV (it's a direct supply business, not a marketplace). Core restaurant revenue in FY25 was ₹2,664 Cr, growing at ~95% YoY in FY25. An important modelling note: the non-restaurant B2B buyer business (non-core) is being scaled down to zero per management guidance, as it competes with Blinkit's own inventory transition. Only the core restaurant business is forecast going forward.
Part 2: Revenue and Cost Forecasts
The model builds a bottom-up revenue forecast for each segment separately, anchored to four drivers: TAM, market share, take rate (for marketplace segments), and margin trajectory.
Forecasting the Current Quarter (Q4 FY26)
Before building a 10-year model, the most immediate test of the model's credibility is its ability to forecast the current quarter. For food delivery, the historical average quarter-on-quarter NOV growth from Q1 FY25 to Q3 FY26 was calculated at 3.6%. Given the India-Pakistan conflict during this period, a qualitative 1.5% downward adjustment was applied to account for near-term dampening of discretionary spend — producing an adjusted Q4 FY26 NOV growth estimate of 2.1%. For quick commerce, QoQ NOV growth has been dramatically higher — the series shows Q1 FY25 at ₹4,061 Cr scaling to ₹13,300 Cr by Q3 FY26 — so the base rate there is materially different. The war adjustment is explicitly noted as non-material to the 10-year model, since India's GDP growth trajectory remains intact at 7.1% (FY27E, per S&P Global).
Total Addressable Market Construction
Each segment has a bespoke TAM methodology, and this is where the model spends significant effort distinguishing itself from industry reports, which are notoriously inconsistent in their definitional scope.
- Food delivery TAM: Uses a top-down China benchmark approach. China is the most mature market globally, with 545 million users spending USD 161 annually (2025 market size: USD 89 billion). India is adjusted using two discount factors: a 43% spend discount (due to lower GDP per capita) and a 70% user discount (due to lower internet penetration and Swiggy's presence). This produces a 2035 food delivery TAM for India of USD 26.4 billion (~₹2,50,907 Cr).
- Quick commerce TAM: Uses a bottom-up approach from India's total retail market (USD 1,060 billion in 2024). Applying 60% to isolate addressable goods, using online penetration scaling from 4.6% to 20% by 2035, and assuming 40% of the online market goes through quick commerce, produces a 2035 TAM of approximately USD 138 billion (~₹13,11,674 Cr).
- Going Out TAM: Decomposed into live events (₹13,000 Cr in 2025), sports events (₹6,912 Cr), box office (₹13,395 Cr), and digital dining out. Dining out isolates the organised sector and digital discovery rate (scaling to 45% by 2035). Combined going out TAM in 2035 is ₹3,34,341 Cr.
- B2B Supplies TAM: A bottom-up build from the food services market (USD 78 billion). Applying 45-50% for the organised sector and the 30% rule for food procurement gives a TAM of ₹89,505 Cr in 2025, scaling to ₹3,10,314 Cr by 2035.
Segment Revenue Forecasts
Food delivery NOV is grown from ₹32,862 Cr in FY25 at management guidance of 16.6% for FY26-27, then decelerating. The model assumes Eternal holds 58% market share in FY25, declining to 55% by 2035. The take rate expands from 31% (Q4 FY25) to 33% by FY35. By 2035, food delivery NOV reaches ₹1,37,999 Cr with revenue of ₹45,540 Cr.
Quick commerce NOV is forecast using average NOV per day per store (scaling to ₹802.5K in FY26-27 with 3,000 stores). Long-run market share is modelled at 40% by 2035 (requiring ~6,000 stores). Revenue transitions to 95% of NOV (inventory-led era). By 2035, Blinkit NOV reaches ₹5,24,670 Cr with revenue of ₹4,98,436 Cr.
Going Out NOV grows to ₹60,254 Cr in 2035. The take rate expands modestly from 11.1% to 12.5%. Revenue by 2035 reaches ₹7,532 Cr.
B2B Supplies core restaurant revenue is anchored to a 31.25% penetration rate of organised restaurants. Revenue by 2035 is ₹17,925 Cr.
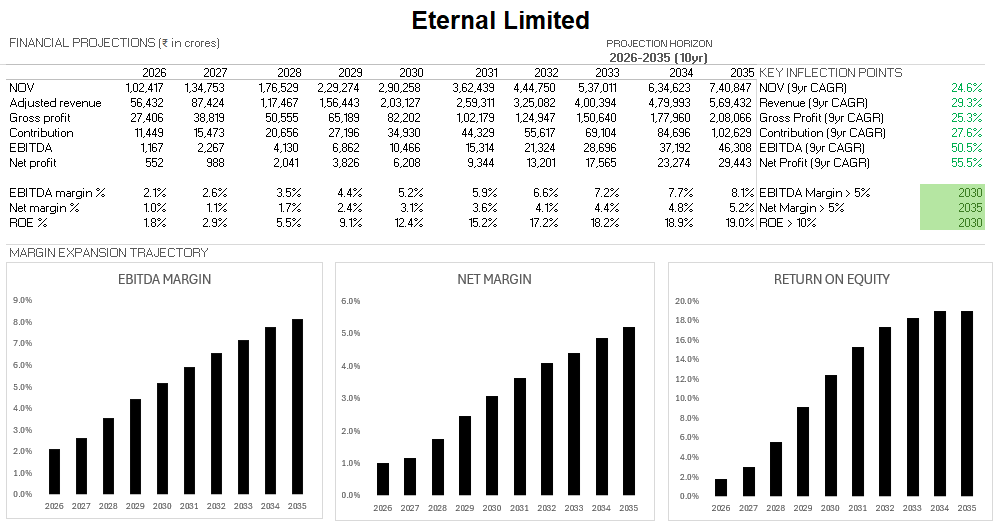
Consolidated: NOV grows to ₹7,40,847 Cr in FY35 (24.6% CAGR). Adjusted revenue grows to ₹5,69,432 Cr (29.3% CAGR, driven by Blinkit's inventory shift).
Cost Structure and Margin Forecasts
Food delivery margins expand from 4.6% EBITDA margin in FY25 to 7.5% by FY35, slightly above management's 5-6% guidance, justified by operating leverage. Contribution margin expands from 9.4% to 12.2%.
Quick commerce margins see gross margin scale to 27.5% by FY35. Contribution margin improves to 11.5% as dark store density increases. EBITDA margin expands from -1.3% (FY25) to 8.0% by FY35.
Going Out margins reflect deep investment (-3.6% in FY26), hitting management's 5% target by FY30, and maturing at 10% by FY35.
B2B Supplies margins are anchored to management's 6% steady-state EBITDA guidance, leveraging supply chain synergies with Blinkit.
Consolidated EBITDA grows to ₹46,308 Cr in FY35 (8.1% margin). Net profit expands to ₹29,443 Cr.
Part 3: The Rest of the DCF — WACC, Working Capital, and Terminal Value
WACC Construction
The cost of equity is derived using the CAPM framework with a Damodaran-style bottom-up beta. Eternal's raw regression beta (~1.10) has a low R-squared (11%), so it is treated as unreliable.
- Bottom-up Beta: Utilizes peers like DoorDash (1.54), Meituan (1.20), Instacart (0.93), and Grab (1.05). Blended unlevered beta is 1.177. Relevered (D/E and 25.2% tax) yields a levered beta of 1.213.
- Risk-Free Rate: Indian 10-year yield at 5.21%.
- Equity Risk Premium: 7.31% (Damodaran developed market + India CRP).
- Cost of Equity: Starts at 14.07% in FY26, declining to 12.52% in FY35. Terminal WACC is 11.07%.
Free Cash Flow to Firm (FCFF) Construction
- D&A and Capex: Capex scales from 1.25% of NOV (investment phase) down to 0.5% at maturity. PP&E, ROU assets, and intangibles are depreciated/amortized according to strict useful life schedules.
- Working Capital: Inventory expands to 17 days by FY35 due to Blinkit's shift. Payables expand to 40 days as bargaining power increases.
- Tax Strategy: Eternal utilizes ₹5,908 Cr in tax loss carry-forwards at 55% utilization against EBT until exhausted, lowering cash tax paid in early years.
- FCFF Trajectory: Turns positive in FY28 (₹329 Cr) and accelerates to ₹27,463 Cr by FY35. PV of explicit FCFFs is ₹32,274 Cr.
Terminal Value and Sensitivity
The terminal value utilizes a 6.0% long-term growth rate and an 11.07% WACC, yielding a PV of ₹57,593 Cr (64% of firm value).
Valuation Output: DCF firm value is ₹89,867 Cr. Adjusting for net cash and investments (₹18,705 Cr), debt, and minority interest produces an equity value of ₹1,10,134 Cr. Divided by 965 Cr shares, the base case intrinsic value is ₹114.13 per share against the June 2026 market price of ₹231.72.
Monte Carlo Simulation
A 10,000-iteration simulation across 31 variables produces a median intrinsic value of ₹136.54 per share. The 99th percentile reaches ₹194.01, and the absolute maximum simulated is ₹246.46.
The verdict: Eternal is structurally a strong business with a compelling compounding story. However, at ₹231.72, the market is pricing in a scenario requiring above-guidance margins, flawless market share retention, or a terminal growth rate well above 6%. The current price embeds significant option value not captured in fundamentals-anchored modelling.